Tables browser
The CrateDB Admin UI comes with a tables browser that allows you to inspect and query regular document tables as well as BLOB tables.
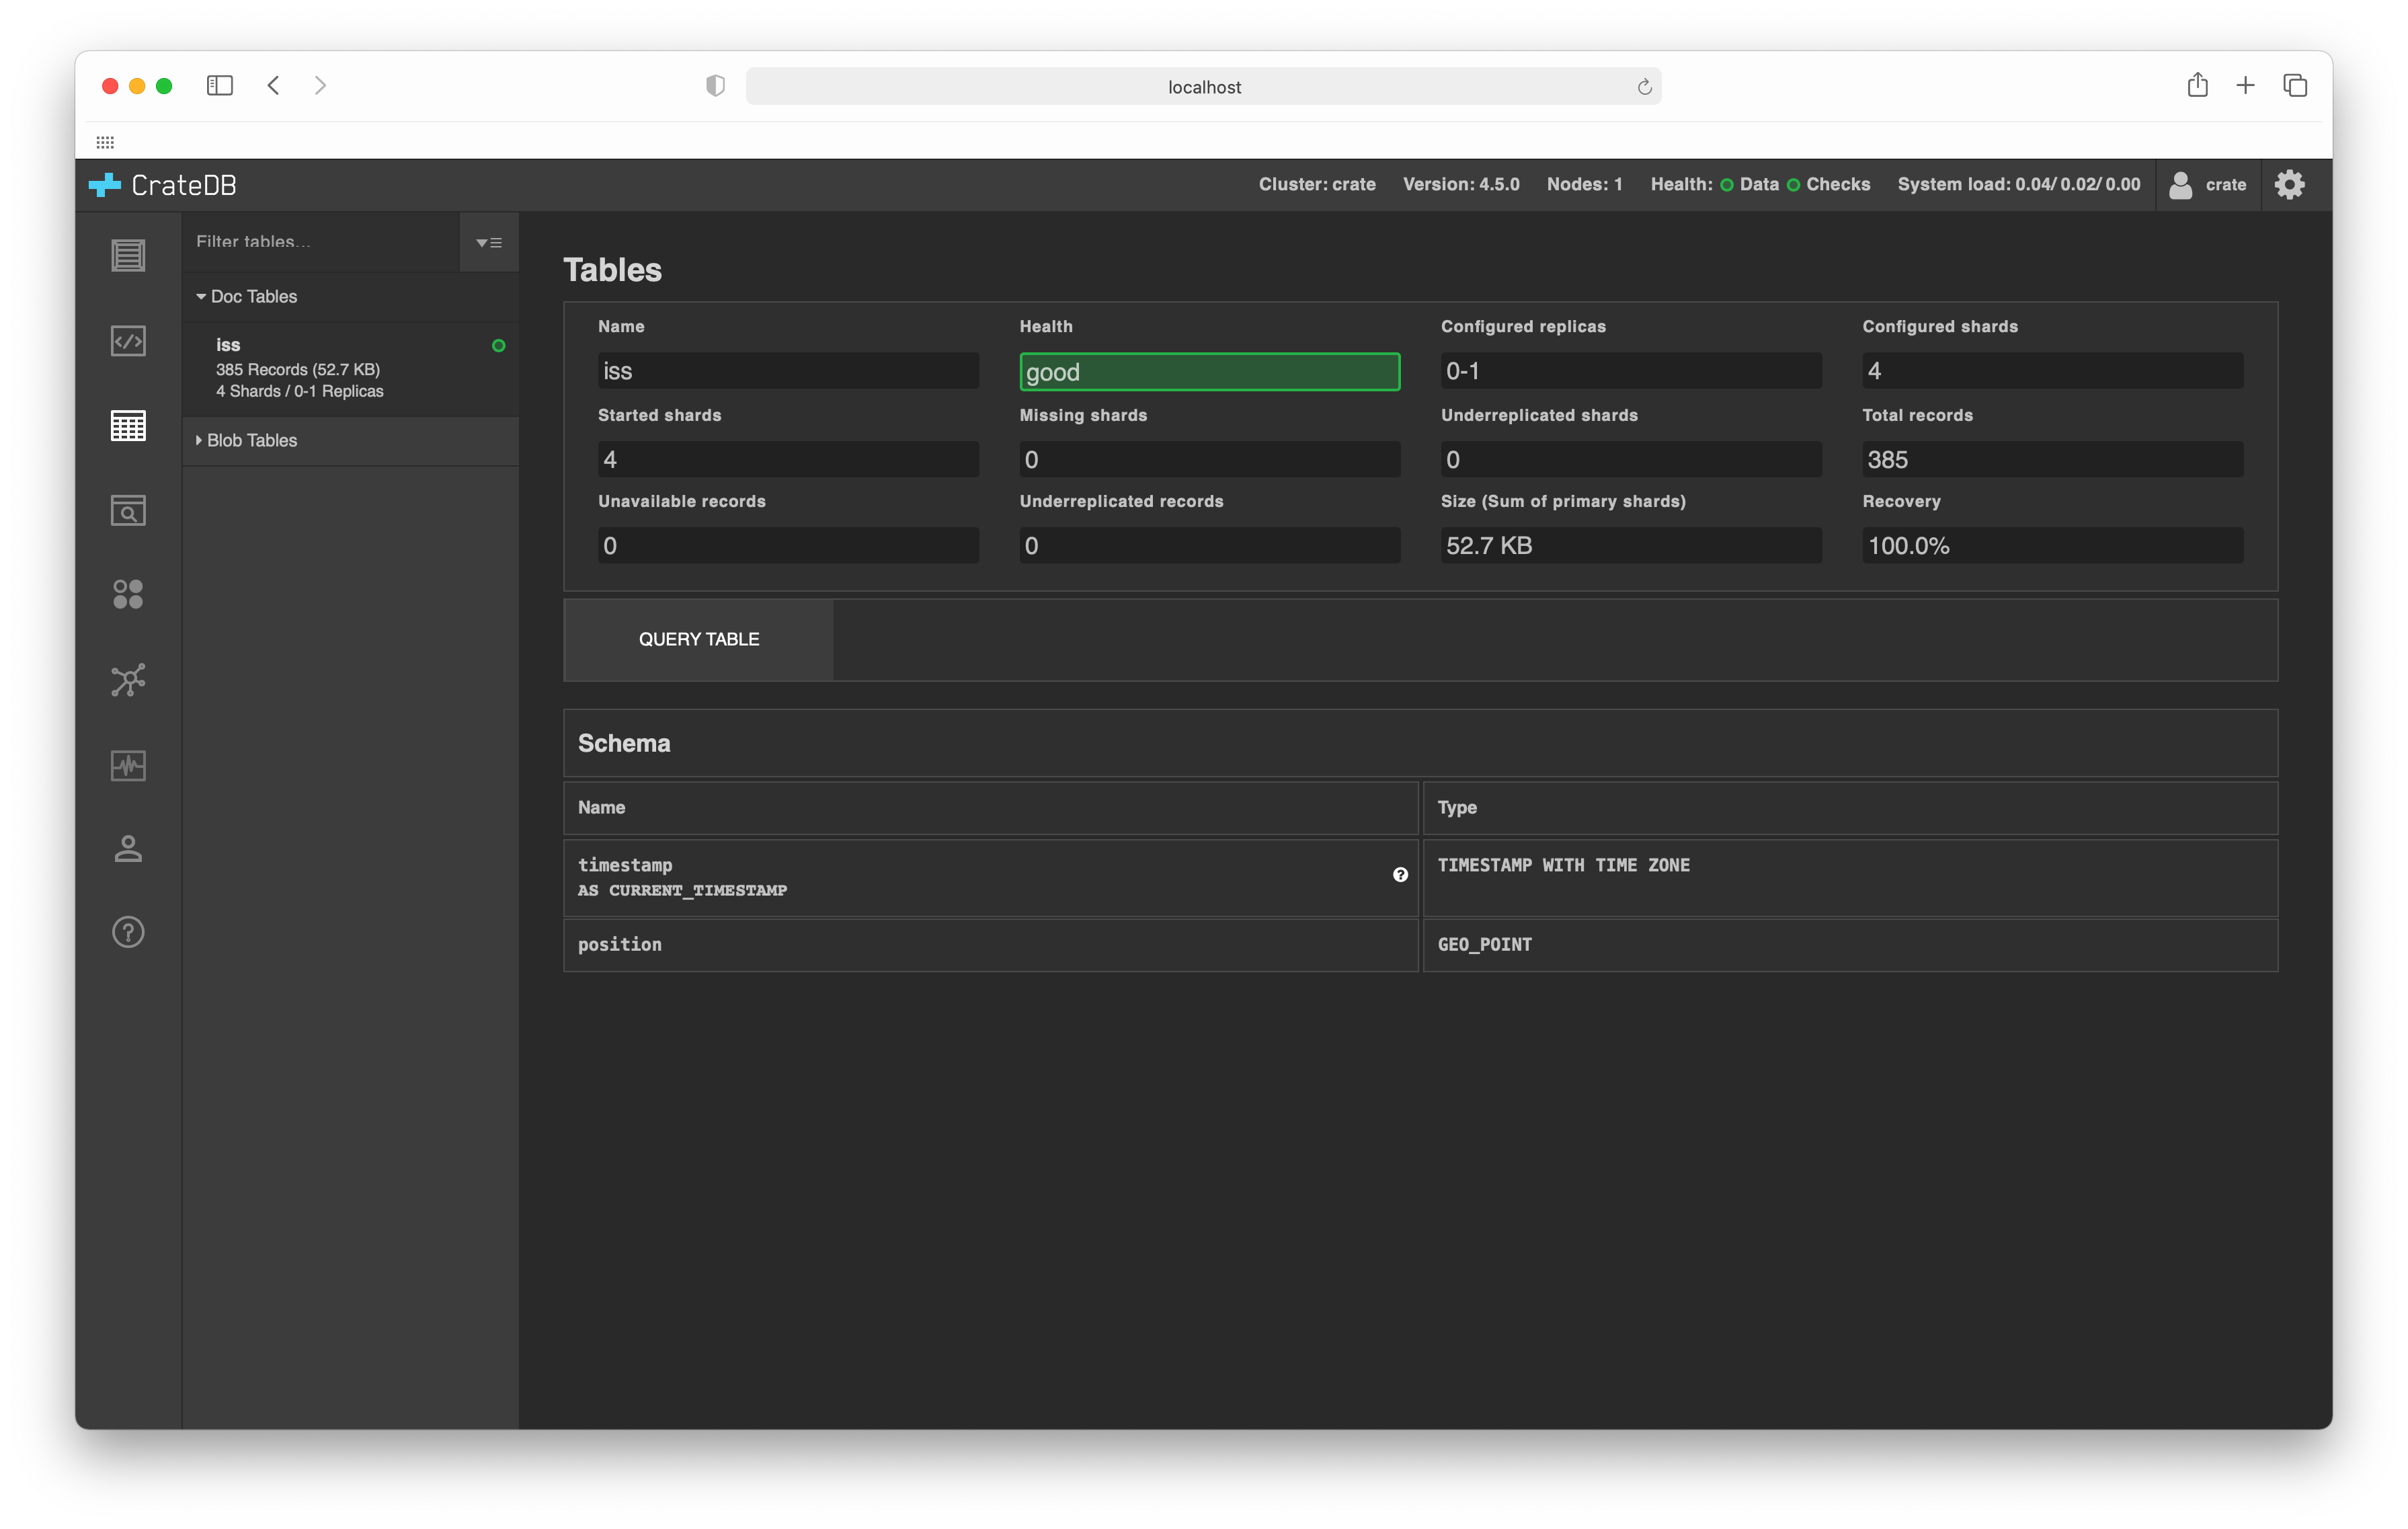
The top section on this screen shows you a basic overview. If you select QUERY TABLE you can query the table using the SQL console.
Below this, you will find the schema information:
If you have BLOB tables, you can access them by selecting the Blob Tables menu item on the left-hand sub-navigation menu.
Features
Overview section
This section displays the following table-level information:
- Name:
The name of the table.
- Health:
The health of the table.
Each table shard has a corresponding health status. The table-level health status always reflects the worst shard status. (Similarly, the cluster-level status always reflects the worst table-level status.)
Shards can be one of the following:
- Green:
The primary shard and all replica shards are allocated to a node.
- Yellow:
The primary shard is allocated, but not all replica shards are allocated to a node.
- Red:
This specific shard is not allocated to a node.
- Configured Replicas:
The number of configured replicas.
- Configured Shards:
- Started Shards:
The number of started shards allocated to a node and available for querying.
- Missing Shards:
The total number of known shards that are missing on disk.
- Underrepl. Shards:
The total number of configured replica shards that are currently missing (i.e. not created or re-created yet).
- Total Records:
The total number of records (i.e. rows) the table has.
- Underrepl. Records:
The total number of records that do not have the required number of replica copies.
- Size:
The total size on disk used by all primary shards.
- Recovery:
The percentage of the recovery process that is complete (i.e. when re-starting a cluster).
Schema section
This section section displays information about each table column:
- Name:
The name of the table column.
- Type:
The column data type.
Other features
- Display toggle:
Different groups of tables can be shown or hidden by toggling the corresponding arrow button on the left-hand sub-navigation menu.
- Table filter:
The displayed list of tables can be filtered by entering text to match against the table name in the Filter tables text input.