Monitoring overview
The CrateDB Admin UI comes with a monitoring overview screen
that allows you to monitor key operational statistics.
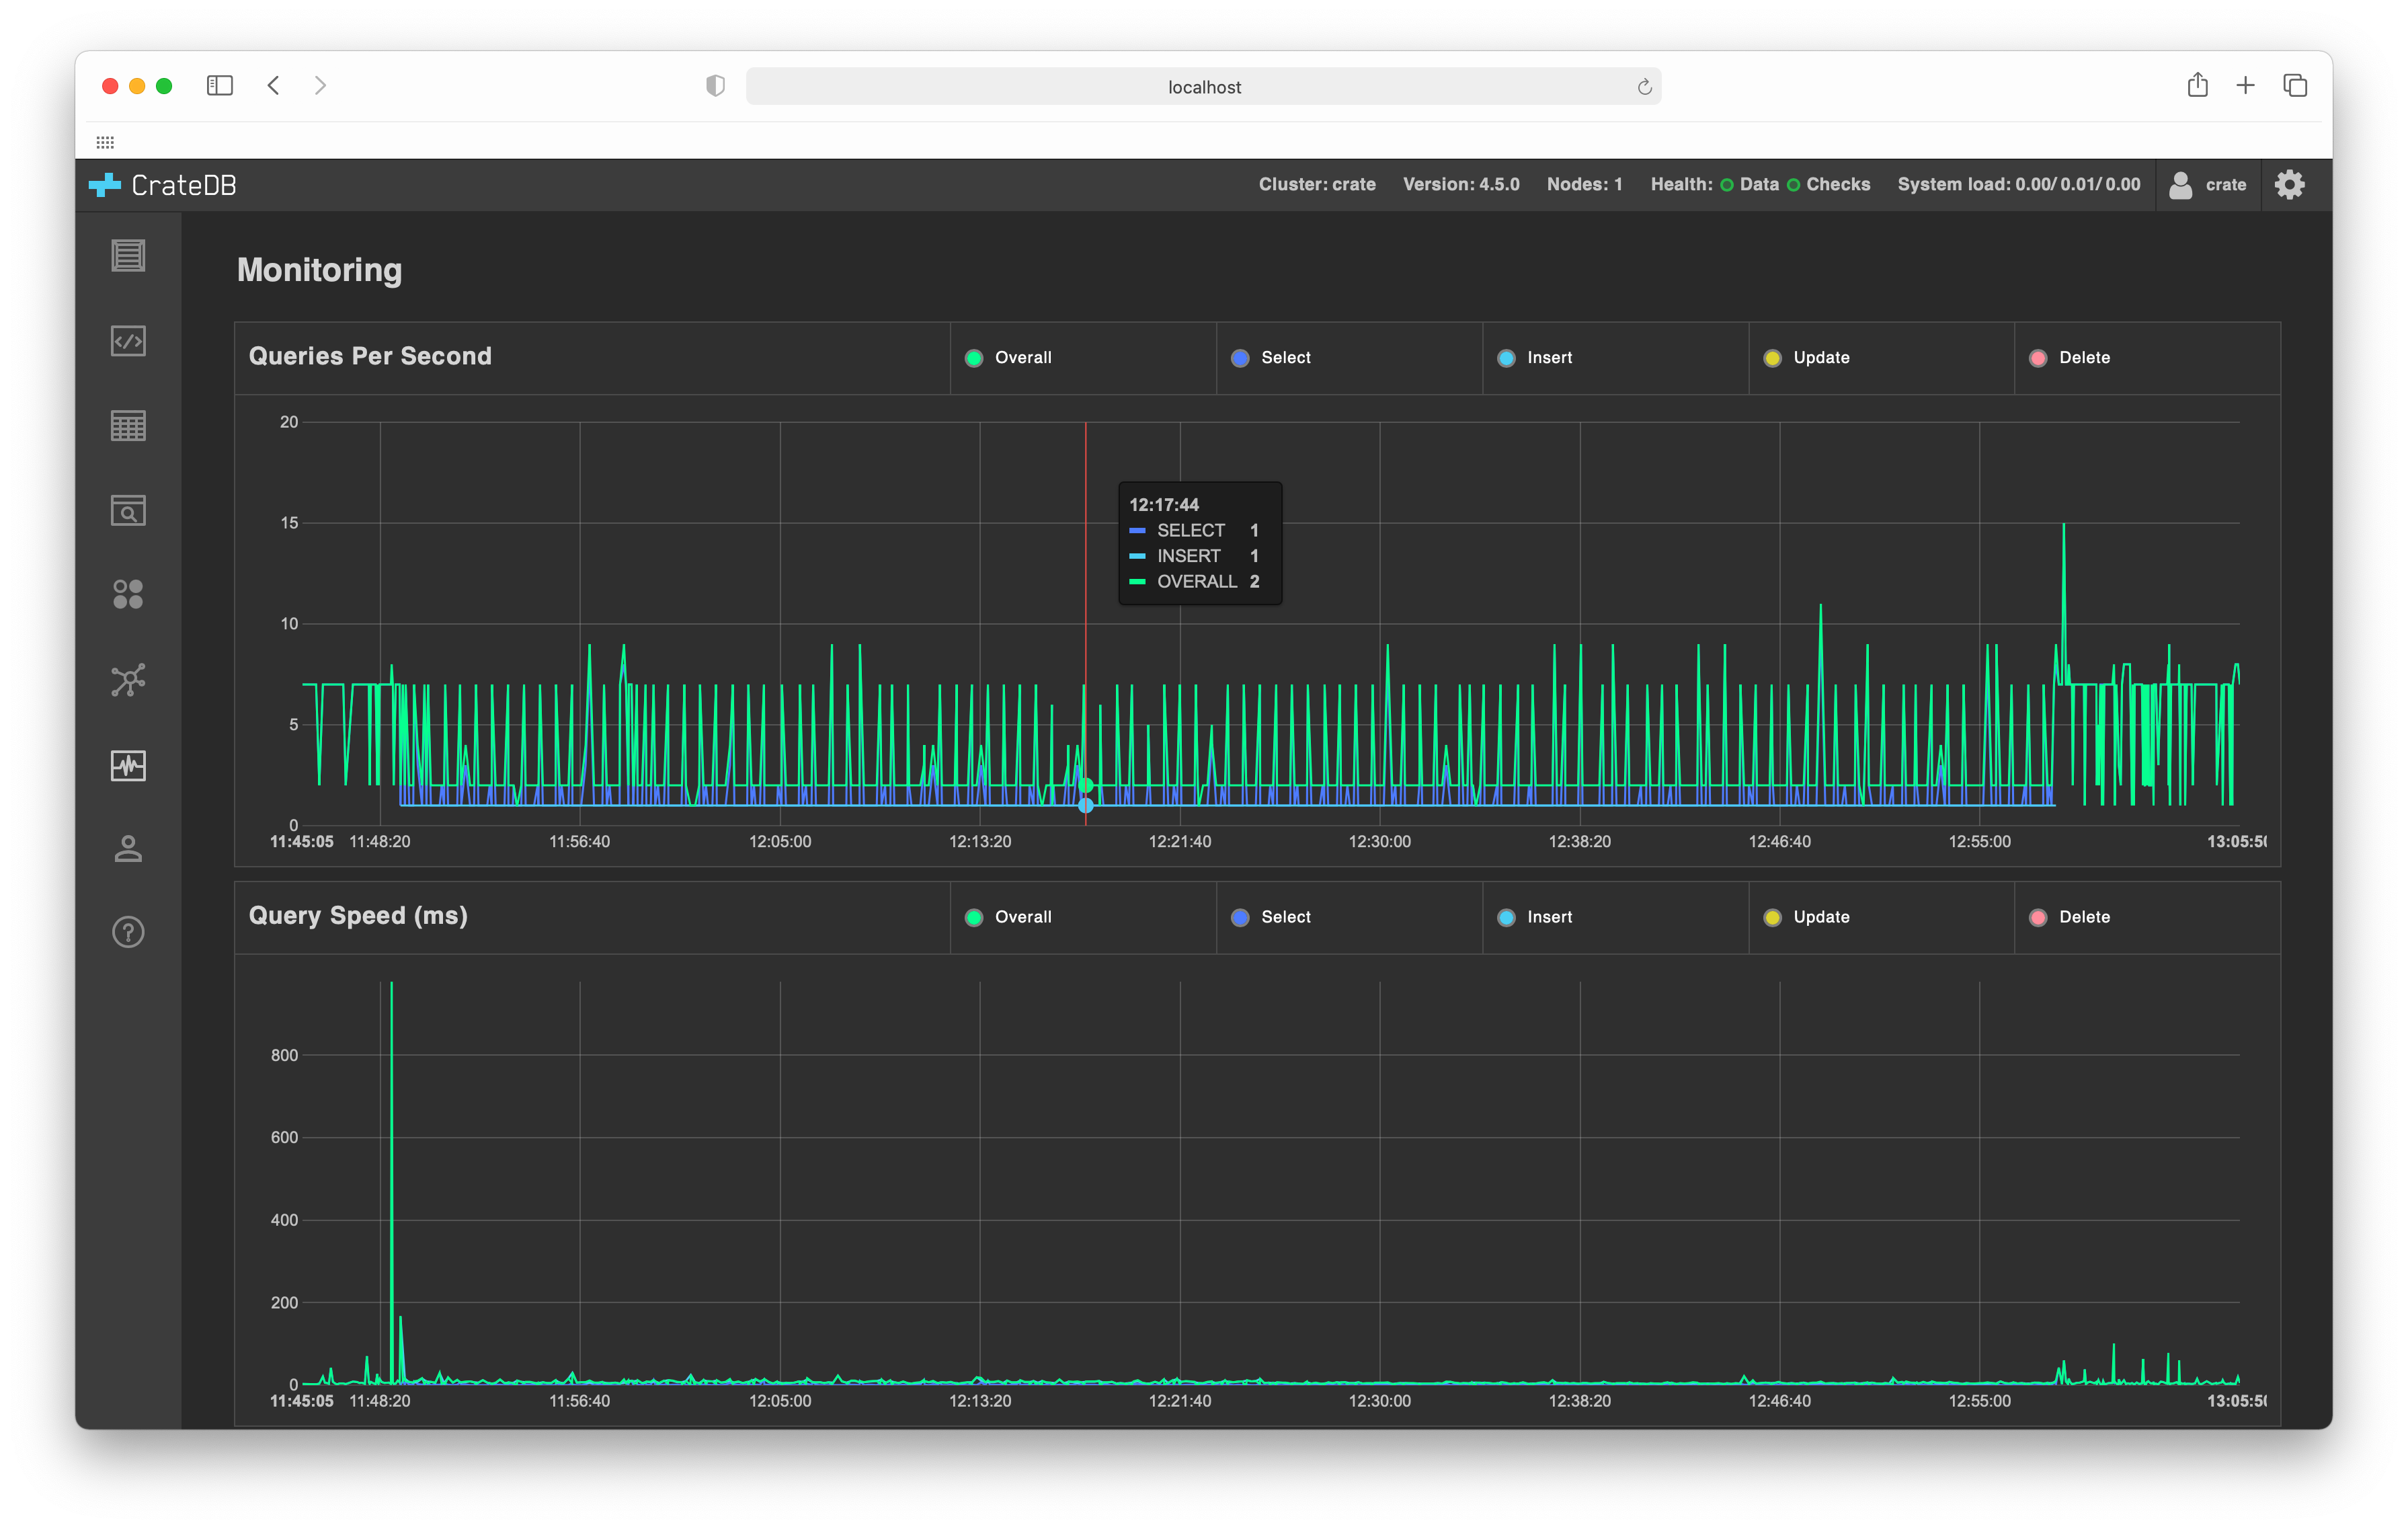
The monitoring page has two live charts:
- Queries Per Second:
This chart graphs the number of queries being run across the entire cluster
per second broken down into the following types:
- Overall:
All queries.
- Select:
All SELECT queries.
- Insert:
All INSERT queries.
- Update:
All UPDATE queries.
- Delete:
All DELETE queries.
- Query Speed:
This chart graphs the execution time of queries being run across the entire
cluster, broken down into the following types:
- Overall:
All queries.
- Select:
All SELECT queries.
- Insert:
All INSERT queries.
- Update:
All UPDATE queries.
- Delete:
All DELETE queries.